made with vue.js
7.338
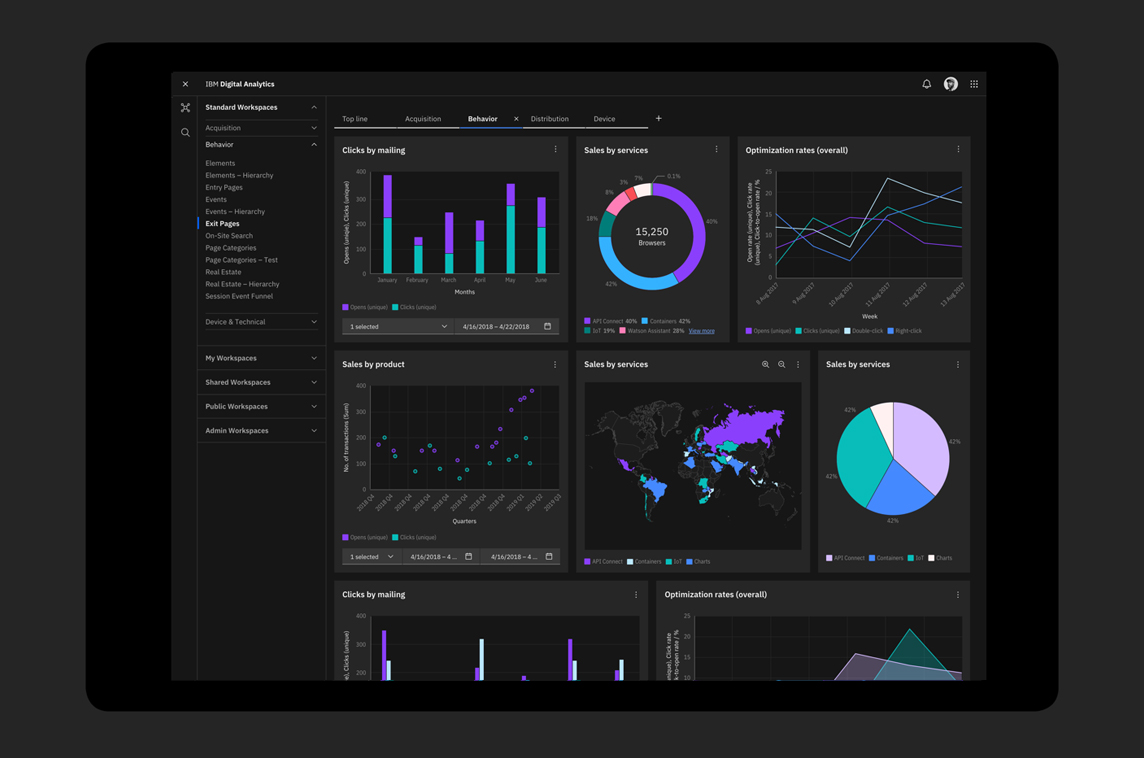
Description
D3 Charting Library
"Carbon Charts is a robust dataviz framework implemented using D3 & TypeScript. The reusable library offers a range of charting components including simple bar, line and pie charts as well as a tree chart, heatmap, wordcloud and more.
It offers a wrapper for Vue.js."

Social Media Links
Schedule-X Vue
Event Calendar Component
8.927
Vue Switches
On/Off Switch Component
7.660
Sentry for Vue
Vue Application Monitoring
💚 Sponsored by Friends

We’re hosting on Digital Ocean! 💙 Try it today and get a free $100 credit.
vue-notifications
Library-agnostic Notifications
2.304
DHTMLX Vue Gantt
Gantt Chart Component
2.383