made with vue.js
17.932
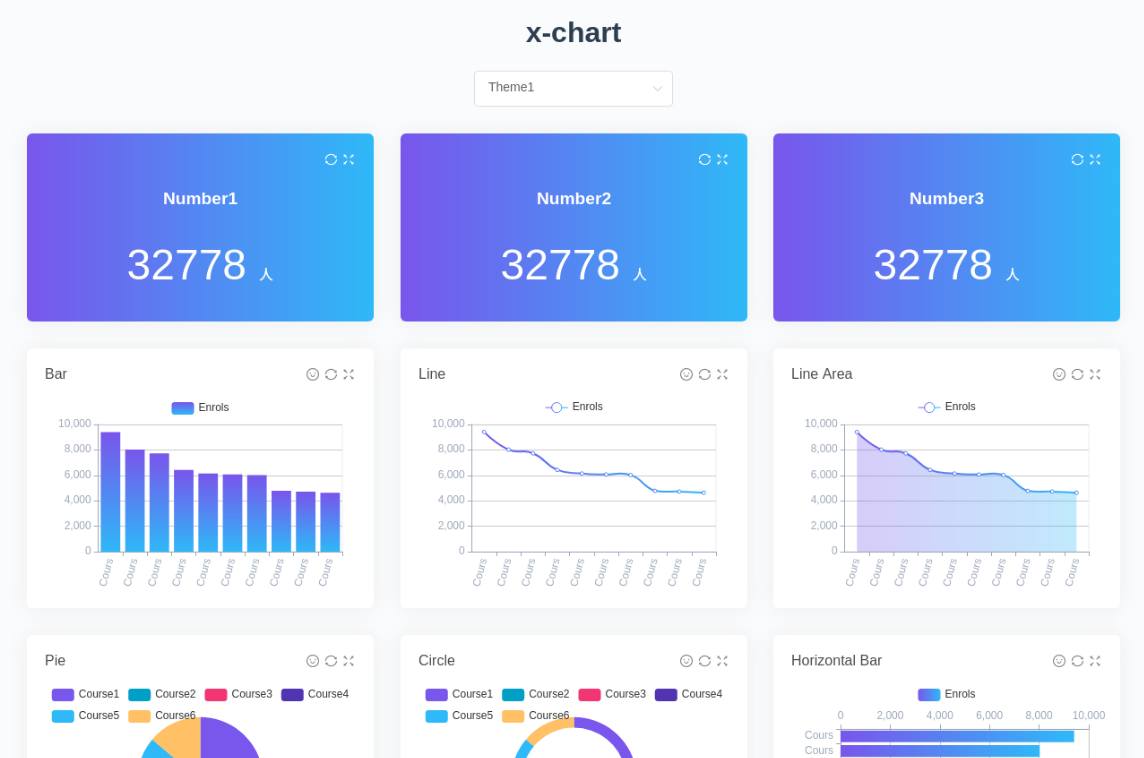
Description
Draggable & resizable data visualization dashboard
"x-chartis a draggable & resizable data visualization dashboard. It's based on Vue.js,vue-echartsandvue-grid-layout."

Social Media Links
Vue Password Strength Meter
Password Strength Meter Component
6.290
Vue Bits
Animated UI Components
4.998
Sentry for Vue
Vue Application Monitoring
💚 Sponsored by Friends

Empower your websites and apps with Quasar Framework
Chakra UI Vue
Component Library
6.489
Vue 3 Select Component
Select Input Control
2.414