After our introduction article about tools and techniques for bugfixing Vue apps, we want to take you on a journey through a real-world debugging process.
We’ll show you how we found and fixed a nasty bug in one of our projects with the help of error & performance monitoring by Sentry.
✨ Sponsored by Sentry: This post is sponsored by Sentry, but we’re describing a real-world scenario where we used their monitoring. We love to partner up with them as we enjoy their product!
The bug
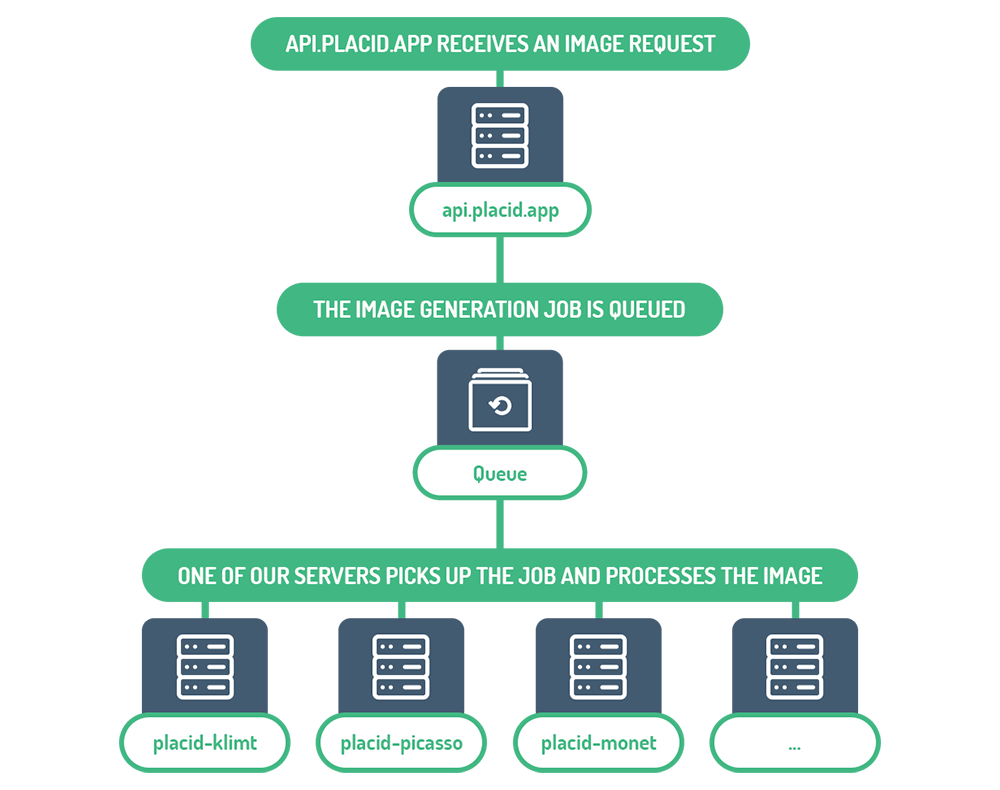
Besides curating our madewith* collections for you, we also run a SaaS. Placid is a toolkit for image generation, including an API and nocode solutions.
The app is powered by web components built with Vue, and a Laravel-based queue system for generated images supported by a growing amount of servers.
Images are created by those servers screenshotting templates using a headless Chrome instance (with Puppeteer).

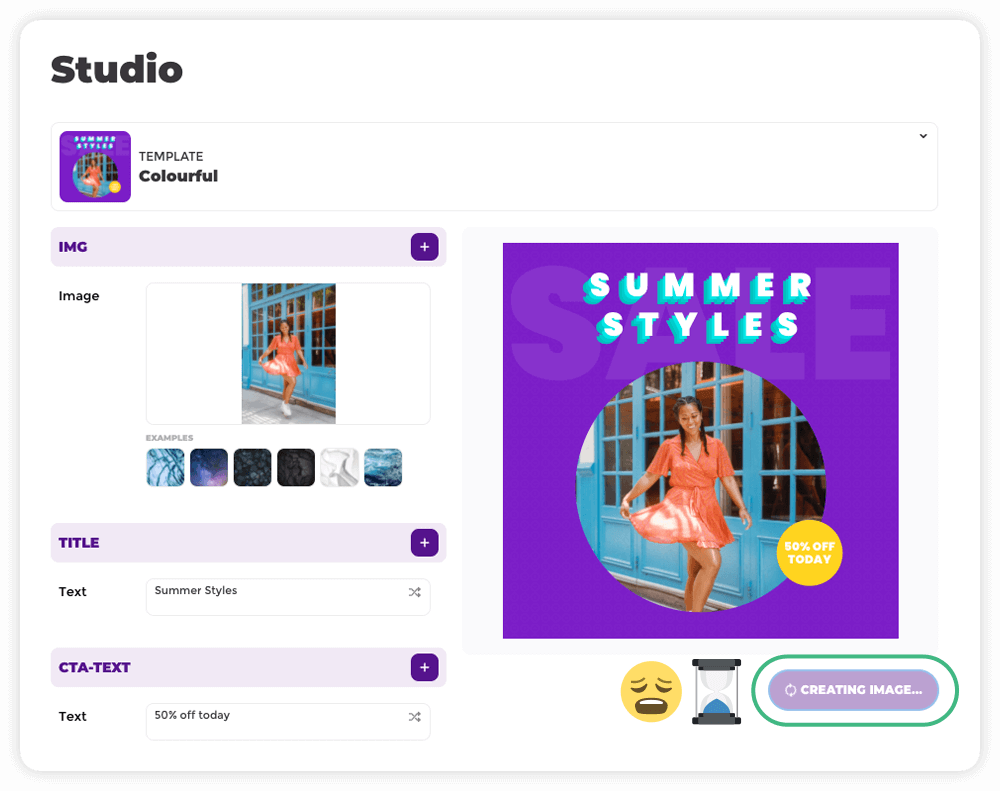
Recently we had a persisting bug where image creation would time out about 1 out of 10,000 times. It popped up in our support, where customers were wondering about sometimes having to wait a long time to get their image after clicking on a „Download“ button in the app.

The hunt
Debugging these kind of things really sucks. Besides a client-side issue it could very well be caused by a hiccup in the image generation process on any of our servers.
Those are practically unreproducible locally. You know how your browser just messes things up sometimes? Headless Chrome is no different. The timeout could be caused by a memory problem, something to do with the OS, a network delay or who knows - different moon phases maybe?
To get more infos about errors that occur in production, we had already set up monitoring with the Sentry SDKs. In their dashboard, they show you a lot of insights about the exceptions they report.
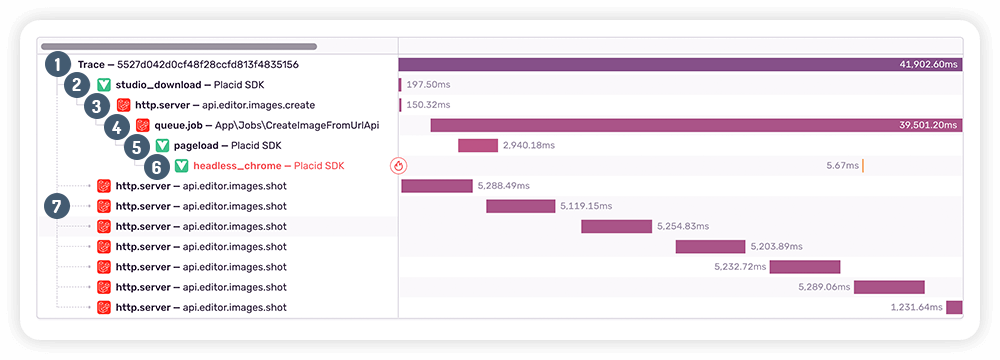
But to pinpoint this bug we needed more context to know what process caused the timeout. So we added distributed tracing, allowing us to connect all the involved events from our frontend (Vue) and backend (Laravel) services. In short: We could follow the bug through all layers of our app 🕵️
The evidence
As soon as a new error of this type got reported in our Sentry dashboard, we started investigating. By viewing the full trace of the error we could see what processes happened before:

- The user opens the page and the trace is created
- The user clicked the „Download“ button in our Placid Studio component
- The API controller receives the request and creates a queue job
- The queue job gets picked up by our server
placid-klimt(yes, they’re all named after painters) and starts processing by starting a headless Chrome instance - The headless Chrome booted up (it has the Sentry SDK embedded as well!)
- 💥 The Sentry Vue SDK captures the error
- Meanwhile, the User UI continues to try to fetch the image
The lead
Looking into those processes, what clues did we find that could help us find the root cause of the timeout?

- We could see that this error happens inside of the headless Chrome instance
- The version of the Chrome instance was outdated and several versions back of what it should have been consistently on all servers
- The
placid-klimtserver seemed to be guilty
The solution
We started examining placid-klimt and found it was using an outdated Chrome version because of a failing bash script that should have updated it. Issues with headless Chrome are not unusual in our workflow, so this was very likely causing a regression.
Every time placid-klimt took a job out of the queue, this bug had a chance of occurring. No wonder we could not reproduce that locally, but it made sense now! Fixing it was a piece of cake compared to finding it.
Fixing bugs across your stack
Full-stack monitoring helped us to connect the bug that surfaced on a button click to its root cause, hidden in our backend stack. Not unusual if your architecture gets a bit more complex!
In our bootstrapped SaaS with a tiny team I had to fix the bug myself anyway 🙃, but this would definitely help larger teams to quickly assign issues to the right person.
While you can use the open-source SDKs by Sentry for Vue, Laravel and many more for free, this specific monitoring setup requires a Sentry subscription – and some curiosity about setting up distributed tracing 🤓
I’m as excited about bugfixing as the next developer (so, not particularly), but investing into your monitoring process saves you the time and nerves you’d else spend digging around in the dark.

