Debugging is one of the most important skills of any developer. Being good at debugging means you’re good at solving problems, which is what this job is all about.
The process of debugging also supports learning about the language or framework you’re using and the app you're working on. It’s how we gain experience!
The principles of debugging are universal for any kind of technology, but of course, there is always some framework-specific tooling available to make it easier. We’ll share our own Vue-proven debugging toolbox with you in this article!
Debugging Basics
Problems in your apps a.k.a. bugs can be caused by syntax or logical errors.
- Syntax errors range from simple typos to not correctly using the building blocks of your language or framework. They are usually easiest to find, and your IDE’s syntax highlighting and suggestions will help a lot.
- Logical errors are the thornier problems: Something does not work out the way you planned or your solution fails in an edge case.
Fixing these errors is called debugging. Usually we only call it debugging when we fix problems in an app that’s already in production. But technically, we also „debug“ while we’re writing new code in the first place: We’re fixing the holes in our algorithm step-by-step.
The Process of Debugging
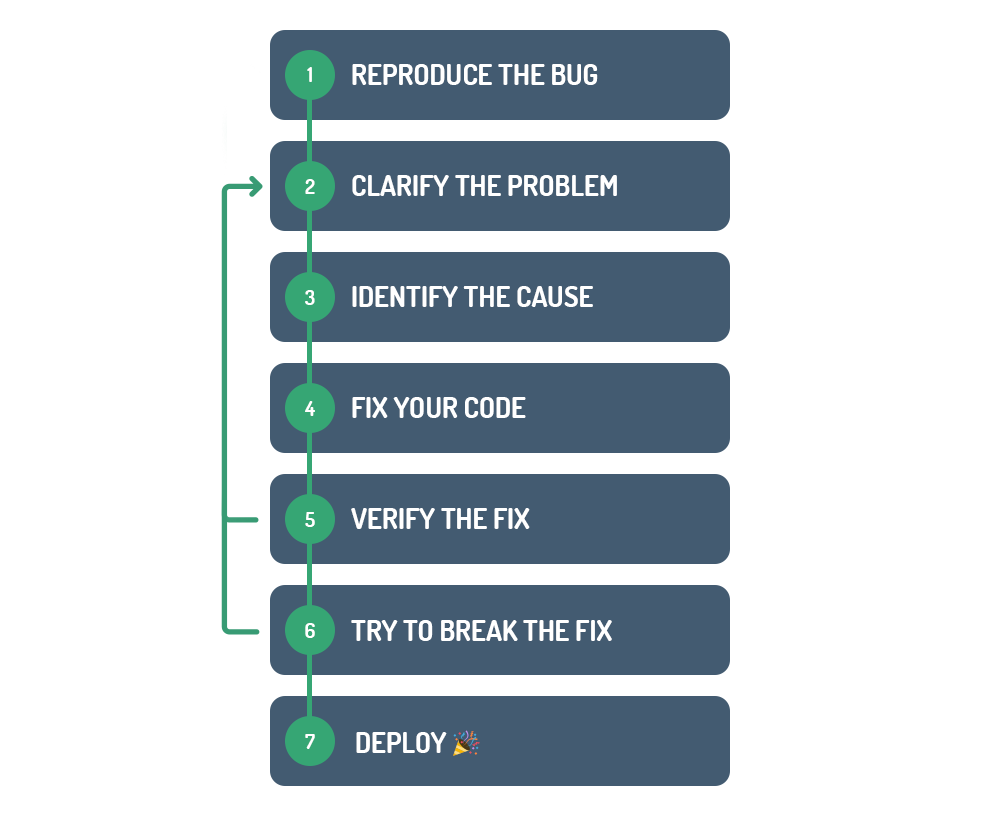
- Reproduce the bug: Try to replicate the workflow to get to the point where the app is failing.
- Clarify the problem: Ask yourself what you expected your code to do exactly, and what happened instead. Clearly articulating this helps with finding the right solution. Ideally, you’d also write a test case now!
- Identify the cause of the problem: To identify the cause, you’ll first make an assumption about what it is – and which function or variable is responsible – and then test it. You think function x doesn’t get the right input? Test it. If your assumption is right, go deeper and find out why.
- Fix your code: Simple as that, right? Actually, yes: If you have a structured process of identifying the cause, fixing your code often isn’t the hard part any more.
- Verify the fix: If you wrote a test case, it should now pass along with any other tests that verify your app still works as it should. Otherwise you’ll have to manually verify that your specific problem is fixed and you didn’t inadvertently break some other part of your app. (That’s why writing tests helps you be more confident when deploying fixes! If you want to learn more about that, head over to our article about testing Vue apps)
- Try to break the fix: No matter whether you have written a test case, it’s always good to manually test the part of the app you were working on, and trying to break it again by for example using different inputs.
- Deploy & party: Take a breath, make yourself a coffee or tea. Who’s the best developer? You are!
While this looks like a straightforward process, it will feel messy in the middle. (You probably already know that!) You'll often jump back to (re-)identifying the cause of the problem, because working on a solution usually creates a better understanding of the problem.
Vue.js Debugging Tools
Debugging JavaScript can be a bit of a hassle. Things are bound to happen asynchronously, which makes it harder to identify the source of your problem – but we have some handy tools at our disposal to make it easier!
Logging & debugging with the web console
Your first go-to tool for Vue debugging is – like with any web app – the browser’s developer tools. They are pretty powerful these days!
The JavaScript console is where you’ll probably spend the most time when debugging your Vue apps.
🚫 Looking for error messages in the console
If the console shows you warnings or errors, read them. This sounds obvious, but people tend to dismiss them. While they aren’t always as specific as we’d like, they often provide hints on where to look for bugs.
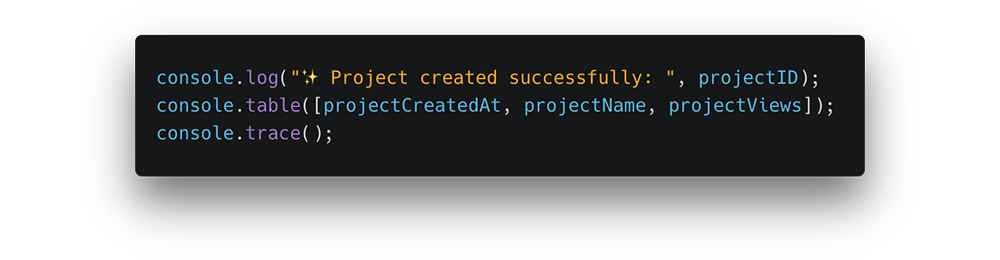
💬 Logging debug messages to the console
You can use the features of the console API to log messages or the values of variables in the console while your code is executing.
This helps you check f.ex. whether a specific function receives the right values, or when and if it gets called.
Use the console functions somewhere in your code to see the output in the console. You'll be A-OK with knowing the following 3. (When in doubt, console.log everything!)
console.log()prints (combinations of) strings, variables and objectsconsole.table()prints data in an array as a tableconsole.trace()prints a stack trace – a list of functions that were called up until that point in your code
🛑 Using debugger statements to add a breakpoint
Adding a debugger; statement to your code pauses the JavaScript execution at this point.
When the browser reaches this breakpoint, you can head over to the console to look at the variable values at that exact point or execute other functions within the current scope to see what happens.
Inspecting components & state with Vue Devtools
The official Vue Devtools offer many additional Vue-specific debugging features. You can install it as a browser extension for Firefox / Chrome or as a standalone Electron app, with which you can also debug Safari, Edge and other browsers.
                        <video
                    muted
                    autoplay
                    playsinline
                    loop
                    class="brick__video">
                <source src="https://madewithnetworkfra.fra1.digitaloceanspaces.com/spatie-space-production/2405/vue-devtools-v3.mp4" type="video/mp4">
            </video>


    </div>

    <div class="brick__caption">
                    <div class="brick__caption-upper">
            <a  href="https://madewithvuejs.com/vue-devtools-v3" class="brick__title">
                Vue Devtools
            </a>
            <span class="brick__tagline">
            Debugging Tools for Vue Apps
        </span>
        </div>
        <div class="brick__caption-lower">
            <div class="pull-left">

                                        <a href="/dev-tools">#Dev Tools</a>
                                                                <a href="/testing">#Testing</a>
                                                                <a href="/browser-extension">#Browser extension</a>
                                                <span class="dots">...</span>
                                                        </div>
            <div class="pull-right">
        <div class="brick__views">
        <svg class="svg-inline u__va--middle" width="20px" height="13px" viewBox="0 0 20 13" version="1.1" xmlns="http://www.w3.org/2000/svg" xmlns:xlink="http://www.w3.org/1999/xlink">
<!-- Generator: Sketch 46.2 (44496) - http://www.bohemiancoding.com/sketch -->
<title>icon-eye-dark</title>
<desc>Created with Sketch.</desc>
<defs></defs>
<g id="Page-1" stroke="none" stroke-width="1" fill="none" fill-rule="evenodd">
    <g id="Icons" transform="translate(-313.000000, -230.000000)" fill-rule="nonzero" fill="#435B71">
        <g id="icon-eye-dark" transform="translate(313.000000, 230.000000)">
            <path d="M9.57827924,0.0932647368 C5.40166592,0.0977121053 2.23909537,3.28527789 0.162366374,6.09013053 C-0.0164829778,6.33193046 -0.0164829778,6.66216481 0.162366374,6.90396474 C2.23923803,9.71401737 5.40085034,12.9011726 9.57827924,12.9068174 C9.57872397,12.9068178 9.57916871,12.9068178 9.57961345,12.9068174 C13.7562192,12.90237 16.9187977,9.71477 18.9955264,6.90995158 C19.1743758,6.66815165 19.1743758,6.3379173 18.9955264,6.09611737 C16.9186536,3.28603053 13.7570499,0.0989094737 9.57961345,0.0932647368 C9.57916871,0.0932643033 9.57872397,0.0932643033 9.57827924,0.0932647368 L9.57827924,0.0932647368 Z M9.57827924,1.46168579 L9.57961345,1.46168579 C12.8675916,1.46681737 15.5988249,3.96846211 17.5569468,6.50236737 C15.5985806,9.03230421 12.8660264,11.5341884 9.57961345,11.5383963 C6.29104758,11.5339489 3.55933568,9.03192789 1.60094367,6.49771474 C3.55930832,3.96777789 6.29185563,1.46589368 9.57827718,1.46168579 L9.57827924,1.46168579 Z" id="Shape"></path>
            <path d="M9.57894737,3.42075158 C7.88659608,3.42075158 6.5,4.80737263 6.5,6.49969895 C6.5,8.19205947 7.88659608,9.57864632 9.57894737,9.57864632 C11.2712987,9.57864632 12.6578947,8.19205947 12.6578947,6.49969895 C12.6578947,4.80737263 11.2712987,3.42075158 9.57894737,3.42075158 Z M9.57894737,4.78917263 C10.5317492,4.78917263 11.2894737,5.54690158 11.2894737,6.49969895 C11.2894737,7.45249632 10.5317492,8.21022526 9.57894737,8.21022526 C8.62614555,8.21022526 7.86842105,7.45249632 7.86842105,6.49969895 C7.86842105,5.54690158 8.62614555,4.78917263 9.57894737,4.78917263 Z" id="Shape"></path>
        </g>
    </g>
</g> </div>In the browser, you can find the Vue Devtools panel in the developer tools. It lets you navigate the component tree and inspect the props and data of your components. Additionally, you can inspect the (Vuex) state, and all the events triggered. No console.log needed 🙂
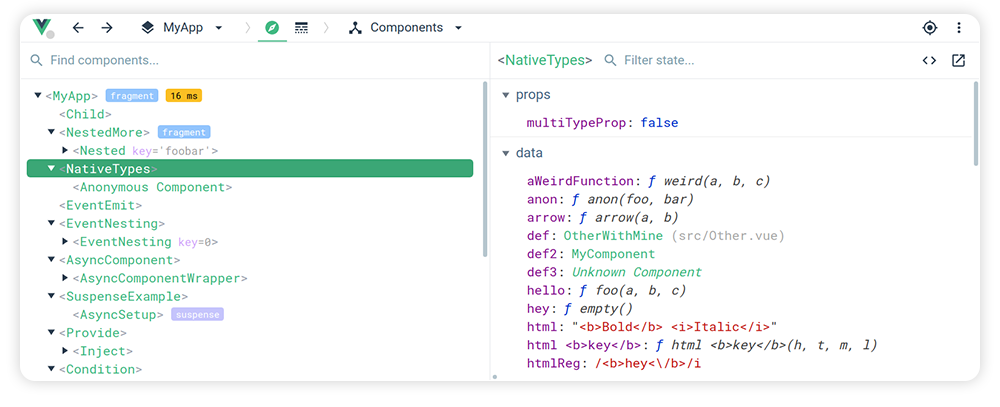
Note that the Vue Devtools only work on apps that are in debug mode, and not on local files (except in Chrome with an extra permission setting for the extension to „Allow access to file URLs“).
Monitoring errors with Sentry
Sentry is a monitoring tool that automatically reports errors & exceptions of your apps, and delivers insights about them. So if you’re debugging an issue in a production app, you’ll get a lot more context about it in Sentry’s dashboard: On which device, OS and browser did it happen? It even shows you what the app was doing before the exception occurred.
There are a lot of options to add more custom data to the reported errors if you set up Sentry right.
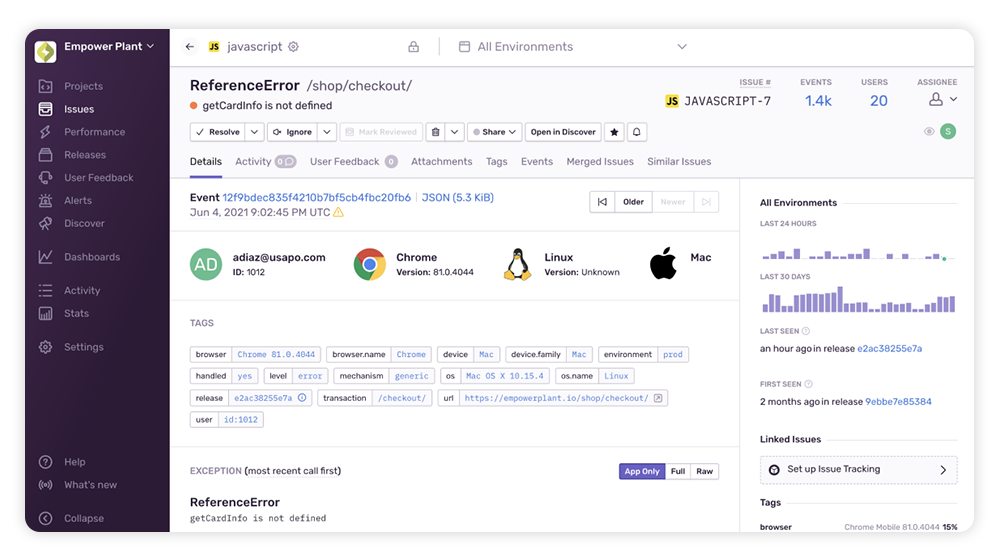
While it’s the most useful for bigger apps and teams, it has been invaluable for my smaller projects as well, which can easily run on their free plan.
Sentry has a SDK for Vue 2 and 3 apps, as well as integrations for backend languages and frameworks. For advanced usage, Sentry also offers connected insights from across your whole stack.
<div class="brick__image-inner "
id="js-image-50"
v-lazy-bg="'https://madewithnetworkfra.fra1.digitaloceanspaces.com/spatie-space-production/29802/sentry-vue-7.jpg'"
style=" ">
</div>
</div>
<div class="brick__caption">
<div class="brick__caption-upper">
<a href="https://madewithvuejs.com/sentry-for-vue" class="brick__title">
Sentry for Vue
</a>
<span class="brick__tagline">
Vue Error & Performance Monitoring
</span>
</div>
<div class="brick__caption-lower">
<div class="pull-left">
<a href="/dev-tools">#Dev Tools</a>
<a href="/integration">#Integration</a>
<a href="/testing">#Testing</a>
<span class="dots">...</span>
</div>
<div class="pull-right">
<div class="brick__views">
<svg class="svg-inline u__va--middle" width="20px" height="13px" viewBox="0 0 20 13" version="1.1" xmlns="http://www.w3.org/2000/svg" xmlns:xlink="http://www.w3.org/1999/xlink">
<!-- Generator: Sketch 46.2 (44496) - http://www.bohemiancoding.com/sketch -->
<title>icon-eye-dark</title>
<desc>Created with Sketch.</desc>
<defs></defs>
<g id="Page-1" stroke="none" stroke-width="1" fill="none" fill-rule="evenodd">
<g id="Icons" transform="translate(-313.000000, -230.000000)" fill-rule="nonzero" fill="#435B71">
<g id="icon-eye-dark" transform="translate(313.000000, 230.000000)">
<path d="M9.57827924,0.0932647368 C5.40166592,0.0977121053 2.23909537,3.28527789 0.162366374,6.09013053 C-0.0164829778,6.33193046 -0.0164829778,6.66216481 0.162366374,6.90396474 C2.23923803,9.71401737 5.40085034,12.9011726 9.57827924,12.9068174 C9.57872397,12.9068178 9.57916871,12.9068178 9.57961345,12.9068174 C13.7562192,12.90237 16.9187977,9.71477 18.9955264,6.90995158 C19.1743758,6.66815165 19.1743758,6.3379173 18.9955264,6.09611737 C16.9186536,3.28603053 13.7570499,0.0989094737 9.57961345,0.0932647368 C9.57916871,0.0932643033 9.57872397,0.0932643033 9.57827924,0.0932647368 L9.57827924,0.0932647368 Z M9.57827924,1.46168579 L9.57961345,1.46168579 C12.8675916,1.46681737 15.5988249,3.96846211 17.5569468,6.50236737 C15.5985806,9.03230421 12.8660264,11.5341884 9.57961345,11.5383963 C6.29104758,11.5339489 3.55933568,9.03192789 1.60094367,6.49771474 C3.55930832,3.96777789 6.29185563,1.46589368 9.57827718,1.46168579 L9.57827924,1.46168579 Z" id="Shape"></path>
<path d="M9.57894737,3.42075158 C7.88659608,3.42075158 6.5,4.80737263 6.5,6.49969895 C6.5,8.19205947 7.88659608,9.57864632 9.57894737,9.57864632 C11.2712987,9.57864632 12.6578947,8.19205947 12.6578947,6.49969895 C12.6578947,4.80737263 11.2712987,3.42075158 9.57894737,3.42075158 Z M9.57894737,4.78917263 C10.5317492,4.78917263 11.2894737,5.54690158 11.2894737,6.49969895 C11.2894737,7.45249632 10.5317492,8.21022526 9.57894737,8.21022526 C8.62614555,8.21022526 7.86842105,7.45249632 7.86842105,6.49969895 C7.86842105,5.54690158 8.62614555,4.78917263 9.57894737,4.78917263 Z" id="Shape"></path>
</g>
</g>
</g> </div>Debugging requests
Your Vue frontend will often rely on fetching data from somewhere, or sending it someplace else. Bugfixing often involves troubleshooting these API requests and responses.
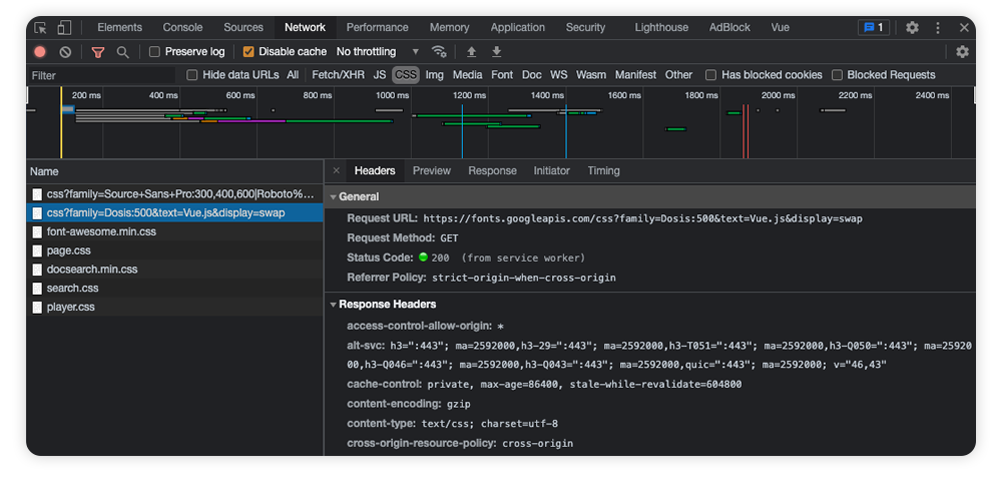
Inspect network activity in your browser’s developer tools
The network tab in the browser devtools shows you all requests and their data. With this info you can check if your data is actually being uploaded or downloaded, and inspect the transferred data like request and response headers, content, timing & size.
Using the API-development tool Postman to debug data flow
Postman is actually a tool for API development, but as we already know: Developing something also means debugging it, so it offers great debugging tools for any API (third-party or your own). It’s great to test, tweak and analyze API requests and responses independently from your app’s context.
With Postman, you can also stack multiple requests together into sequences that can be saved into collections to test and quickly re-test them in combination.
To learn more about how Postman works, head over to the Postman learning center.
There’s an open-source and web-based Postman alternative #madewithvuejs, by the way – check out Hoppscotch!
            <div class="brick__image-inner "
                 id="js-image-2063"
                 v-lazy-bg="'https://madewithnetworkfra.fra1.digitaloceanspaces.com/spatie-space-production/30425/hoppscotch-4.jpg'"
                style=" ">

            </div>


    </div>

    <div class="brick__caption">
                    <div class="brick__caption-upper">
            <a  href="https://madewithvuejs.com/hoppscotch" class="brick__title">
                Hoppscotch
            </a>
            <span class="brick__tagline">
            Open-source API Development Ecosystem
        </span>
        </div>
        <div class="brick__caption-lower">
            <div class="pull-left">

                                        <a href="/webapps">#Webapps</a>
                                                                <a href="/dev-tools">#Dev Tools</a>
                                                                <a href="/pwa">#PWA</a>
                                                <span class="dots">...</span>
                                                        </div>
            <div class="pull-right">
        <div class="brick__views">
        <svg class="svg-inline u__va--middle" width="20px" height="13px" viewBox="0 0 20 13" version="1.1" xmlns="http://www.w3.org/2000/svg" xmlns:xlink="http://www.w3.org/1999/xlink">
<!-- Generator: Sketch 46.2 (44496) - http://www.bohemiancoding.com/sketch -->
<title>icon-eye-dark</title>
<desc>Created with Sketch.</desc>
<defs></defs>
<g id="Page-1" stroke="none" stroke-width="1" fill="none" fill-rule="evenodd">
    <g id="Icons" transform="translate(-313.000000, -230.000000)" fill-rule="nonzero" fill="#435B71">
        <g id="icon-eye-dark" transform="translate(313.000000, 230.000000)">
            <path d="M9.57827924,0.0932647368 C5.40166592,0.0977121053 2.23909537,3.28527789 0.162366374,6.09013053 C-0.0164829778,6.33193046 -0.0164829778,6.66216481 0.162366374,6.90396474 C2.23923803,9.71401737 5.40085034,12.9011726 9.57827924,12.9068174 C9.57872397,12.9068178 9.57916871,12.9068178 9.57961345,12.9068174 C13.7562192,12.90237 16.9187977,9.71477 18.9955264,6.90995158 C19.1743758,6.66815165 19.1743758,6.3379173 18.9955264,6.09611737 C16.9186536,3.28603053 13.7570499,0.0989094737 9.57961345,0.0932647368 C9.57916871,0.0932643033 9.57872397,0.0932643033 9.57827924,0.0932647368 L9.57827924,0.0932647368 Z M9.57827924,1.46168579 L9.57961345,1.46168579 C12.8675916,1.46681737 15.5988249,3.96846211 17.5569468,6.50236737 C15.5985806,9.03230421 12.8660264,11.5341884 9.57961345,11.5383963 C6.29104758,11.5339489 3.55933568,9.03192789 1.60094367,6.49771474 C3.55930832,3.96777789 6.29185563,1.46589368 9.57827718,1.46168579 L9.57827924,1.46168579 Z" id="Shape"></path>
            <path d="M9.57894737,3.42075158 C7.88659608,3.42075158 6.5,4.80737263 6.5,6.49969895 C6.5,8.19205947 7.88659608,9.57864632 9.57894737,9.57864632 C11.2712987,9.57864632 12.6578947,8.19205947 12.6578947,6.49969895 C12.6578947,4.80737263 11.2712987,3.42075158 9.57894737,3.42075158 Z M9.57894737,4.78917263 C10.5317492,4.78917263 11.2894737,5.54690158 11.2894737,6.49969895 C11.2894737,7.45249632 10.5317492,8.21022526 9.57894737,8.21022526 C8.62614555,8.21022526 7.86842105,7.45249632 7.86842105,6.49969895 C7.86842105,5.54690158 8.62614555,4.78917263 9.57894737,4.78917263 Z" id="Shape"></path>
        </g>
    </g>
</g> </div>Getting better-looking debug infos with Ray
Ray is a desktop app by Spatie that is such a useful helper for debugging, especially if you work with a stack including Vue & Laravel (like us 😅).
You can send debugging messages and component data to the Ray app and it will format the output and displays the origin of your calls. You can then color-code, group and filter your dumps in a convenient UI.
Use it in your Vue 2 or 3 projects with vue-ray!
            <div class="brick__image-inner "
                 id="js-image-3199"
                 v-lazy-bg="'https://madewithnetworkfra.fra1.digitaloceanspaces.com/spatie-space-production/28122/vue-ray.jpg'"
                style=" ">

            </div>


    </div>

    <div class="brick__caption">
                    <div class="brick__caption-upper">
            <a  href="https://madewithvuejs.com/vue-ray" class="brick__title">
                Vue Ray
            </a>
            <span class="brick__tagline">
            Debug your Vue code with Ray
        </span>
        </div>
        <div class="brick__caption-lower">
            <div class="pull-left">

                                        <a href="/dev-tools">#Dev Tools</a>
                                                                <a href="/testing">#Testing</a>
                                                                <a href="/debug">#Debug</a>
                                                        </div>
            <div class="pull-right">
        <div class="brick__views">
        <svg class="svg-inline u__va--middle" width="20px" height="13px" viewBox="0 0 20 13" version="1.1" xmlns="http://www.w3.org/2000/svg" xmlns:xlink="http://www.w3.org/1999/xlink">
<!-- Generator: Sketch 46.2 (44496) - http://www.bohemiancoding.com/sketch -->
<title>icon-eye-dark</title>
<desc>Created with Sketch.</desc>
<defs></defs>
<g id="Page-1" stroke="none" stroke-width="1" fill="none" fill-rule="evenodd">
    <g id="Icons" transform="translate(-313.000000, -230.000000)" fill-rule="nonzero" fill="#435B71">
        <g id="icon-eye-dark" transform="translate(313.000000, 230.000000)">
            <path d="M9.57827924,0.0932647368 C5.40166592,0.0977121053 2.23909537,3.28527789 0.162366374,6.09013053 C-0.0164829778,6.33193046 -0.0164829778,6.66216481 0.162366374,6.90396474 C2.23923803,9.71401737 5.40085034,12.9011726 9.57827924,12.9068174 C9.57872397,12.9068178 9.57916871,12.9068178 9.57961345,12.9068174 C13.7562192,12.90237 16.9187977,9.71477 18.9955264,6.90995158 C19.1743758,6.66815165 19.1743758,6.3379173 18.9955264,6.09611737 C16.9186536,3.28603053 13.7570499,0.0989094737 9.57961345,0.0932647368 C9.57916871,0.0932643033 9.57872397,0.0932643033 9.57827924,0.0932647368 L9.57827924,0.0932647368 Z M9.57827924,1.46168579 L9.57961345,1.46168579 C12.8675916,1.46681737 15.5988249,3.96846211 17.5569468,6.50236737 C15.5985806,9.03230421 12.8660264,11.5341884 9.57961345,11.5383963 C6.29104758,11.5339489 3.55933568,9.03192789 1.60094367,6.49771474 C3.55930832,3.96777789 6.29185563,1.46589368 9.57827718,1.46168579 L9.57827924,1.46168579 Z" id="Shape"></path>
            <path d="M9.57894737,3.42075158 C7.88659608,3.42075158 6.5,4.80737263 6.5,6.49969895 C6.5,8.19205947 7.88659608,9.57864632 9.57894737,9.57864632 C11.2712987,9.57864632 12.6578947,8.19205947 12.6578947,6.49969895 C12.6578947,4.80737263 11.2712987,3.42075158 9.57894737,3.42075158 Z M9.57894737,4.78917263 C10.5317492,4.78917263 11.2894737,5.54690158 11.2894737,6.49969895 C11.2894737,7.45249632 10.5317492,8.21022526 9.57894737,8.21022526 C8.62614555,8.21022526 7.86842105,7.45249632 7.86842105,6.49969895 C7.86842105,5.54690158 8.62614555,4.78917263 9.57894737,4.78917263 Z" id="Shape"></path>
        </g>
    </g>
</g> </div>