Even the best developers end up with performance issues in their apps and sites. Sometimes we’re just so focused on building a new feature that we lose track of how performant these new bits of code are. Super normal.
How can we keep track of performance over time? What should be our goals? Are we as Vue.js developers responsible for all performance issues?
This article is a follow-up to our Vue.js Performance Guide that covers the basics of performance optimization. It helps you wrap your head around performance monitoring and its most important metrics.
Overview of performance metrics
Every metric has its pros and cons. We can collect a lot of data, but it’s good to know its limitations. We want to choose a mixture of metrics from all categories to tackle performance monitoring from all angles.
📐 Rule-based performance metrics
Rule-based metrics calculate performance scores based on a weighted collection of measurements, like the Lighthouse or PageSpeed scores.
Pros:
- You get a simple metric that you can easily communicate with your team
- It’s one / few combined metric(s) you can easily keep track of
Cons:
- Most of these metrics are not based on actual experiences of your users
- Building an average combined metric means we’re (over)simplifying
- They are not actionable at all
🔢 Quantity-based performance metrics
Another group of metrics includes all things you can count directly: Your bundle size, or the number of requests.
Pros:
- These metrics can quickly alert you of specific issues (e.g. uncompressed images, or heavy-weight third-party packages) - super actionable
Cons:
- Most of these metrics are only theoretically connected to your real user’s experience
🙋 User-centric performance metrics
The third group of metrics show the perceived performance of a site, measuring load speed, responsiveness and smoothness.
Important metrics include for example the Largest Contentful Paint, First Input Delay and Cumulative Layout Shift, which you might know as Google's Web Vitals.
Pros:
- These metrics describe your user’s experience, including how it responds to interactions
- They include different experiences of your users, factoring in fast or slow networks, low-end or powerful devices,..
Cons:
- These metrics are not as actionable on their own and often need trial and error to improve
Which performance metrics should I focus on?
There are thousands of individual metrics that you could measure, but there have been a lot standardization efforts in the last few years.
The Google Web Vitals are a good starting point. To help you make your own decisions, I’m going to share what exactly we’re focusing on with our projects, and why.
For us, the most important metrics are always based on user experience. Obviously we want to create a nice experience, but this focus has also worked out well regarding to our search rankings. The results of your Web Vitals are also factored in your page rank!
The metrics we regularly look at are:
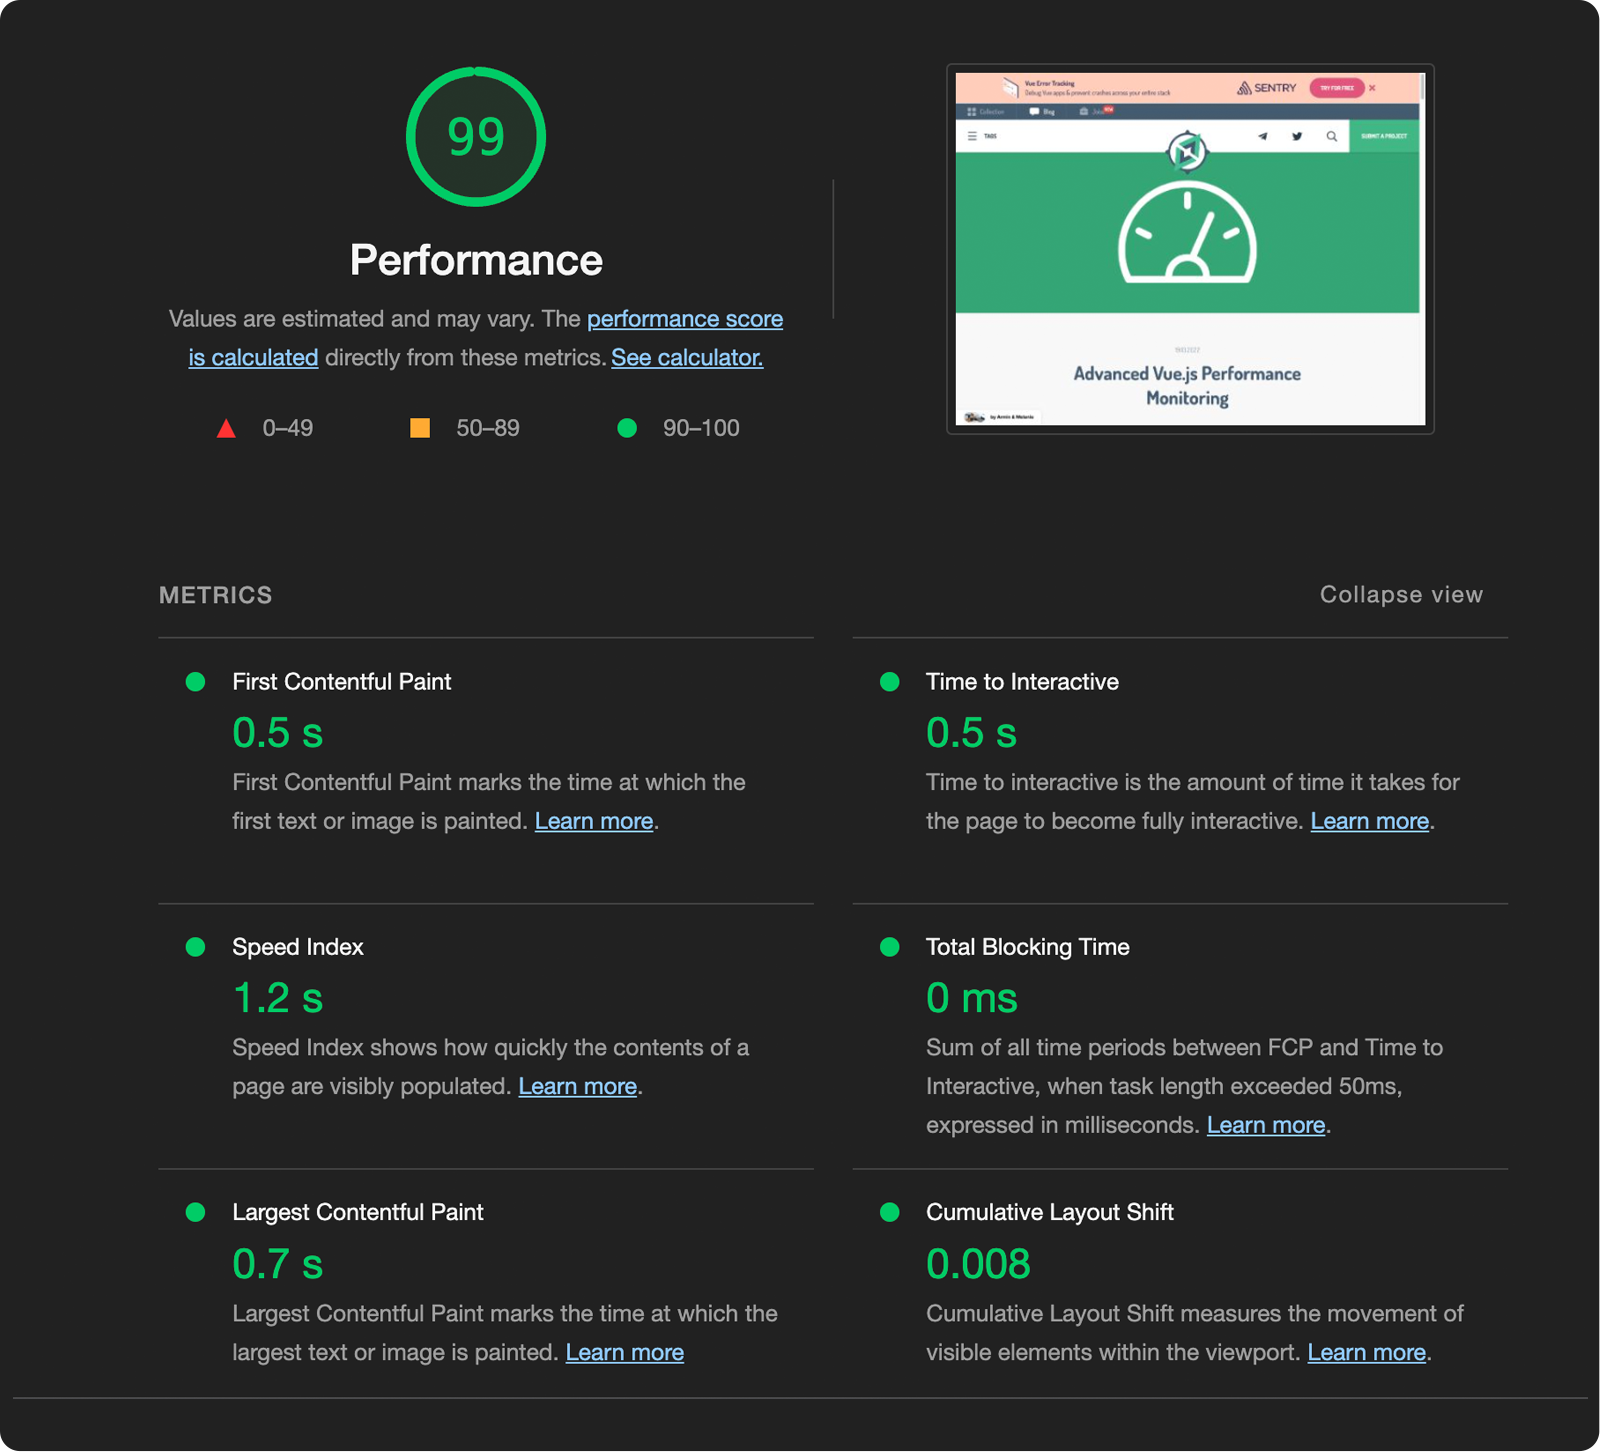
- Lighthouse performance score: One super simple value that combines important (user-centric) metrics and works as a high-level summary for us.
- TTFB – Time To First Byte: This metric measures how long it takes a user to receive the first byte of our content. It helps us identify issues with slow server response times.
- LCP – Largest Contentful Paint: This metric is part of the Core Web Vitals. It describes when the largest block of content is visible to users. It’s an important milestone in perceived performance.
- FID – First Input Delay: Also part of the Core Web Vitals, it describes the response time when users try to first interact with our app. Slow response times and problems with interactivity are a direct factor for user frustration. As this metric can only be measured with real user interactions, we use TBT – Total Blocking Time for checks and debugging without user data.
- CLS – Cumulative Layout Shift: The third Core Web Vital measures the visual stability of a page when it’s loaded. Does it jump around a lot as images get loaded for example?
It’s a nice set to start with and can easily be checked either manually via the devtools, or with automated workflows:
- Run Lighthouse audits programmatically with Lighthouse CI
- Check your code against your performance goals within your build process
- Script page interactions with WebPageTest to create multi-step tests
- Use the free and open-source tools by sitespeed.io to measure web performance metrics continuously and display data in a dashboard
Personally, we use some automated "lab" checks while developing, but we track our real-world performance over time with our monitoring solution Sentry.
<div class="brick__image-inner "
id="js-image-50"
v-lazy-bg="'https://madewithnetworkfra.fra1.digitaloceanspaces.com/spatie-space-production/29802/sentry-vue-7.jpg'"
style=" ">
</div>
</div>
<div class="brick__caption">
<div class="brick__caption-upper">
<a href="https://madewithvuejs.com/sentry-for-vue" class="brick__title">
Sentry for Vue
</a>
<span class="brick__tagline">
Vue Error & Performance Monitoring
</span>
</div>
<div class="brick__caption-lower">
<div class="pull-left">
<a href="/dev-tools">#Dev Tools</a>
<a href="/integration">#Integration</a>
<a href="/testing">#Testing</a>
<span class="dots">...</span>
</div>
<div class="pull-right">
<div class="brick__views">
<svg class="svg-inline u__va--middle" width="20px" height="13px" viewBox="0 0 20 13" version="1.1" xmlns="http://www.w3.org/2000/svg" xmlns:xlink="http://www.w3.org/1999/xlink">
<!-- Generator: Sketch 46.2 (44496) - http://www.bohemiancoding.com/sketch -->
<title>icon-eye-dark</title>
<desc>Created with Sketch.</desc>
<defs></defs>
<g id="Page-1" stroke="none" stroke-width="1" fill="none" fill-rule="evenodd">
<g id="Icons" transform="translate(-313.000000, -230.000000)" fill-rule="nonzero" fill="#435B71">
<g id="icon-eye-dark" transform="translate(313.000000, 230.000000)">
<path d="M9.57827924,0.0932647368 C5.40166592,0.0977121053 2.23909537,3.28527789 0.162366374,6.09013053 C-0.0164829778,6.33193046 -0.0164829778,6.66216481 0.162366374,6.90396474 C2.23923803,9.71401737 5.40085034,12.9011726 9.57827924,12.9068174 C9.57872397,12.9068178 9.57916871,12.9068178 9.57961345,12.9068174 C13.7562192,12.90237 16.9187977,9.71477 18.9955264,6.90995158 C19.1743758,6.66815165 19.1743758,6.3379173 18.9955264,6.09611737 C16.9186536,3.28603053 13.7570499,0.0989094737 9.57961345,0.0932647368 C9.57916871,0.0932643033 9.57872397,0.0932643033 9.57827924,0.0932647368 L9.57827924,0.0932647368 Z M9.57827924,1.46168579 L9.57961345,1.46168579 C12.8675916,1.46681737 15.5988249,3.96846211 17.5569468,6.50236737 C15.5985806,9.03230421 12.8660264,11.5341884 9.57961345,11.5383963 C6.29104758,11.5339489 3.55933568,9.03192789 1.60094367,6.49771474 C3.55930832,3.96777789 6.29185563,1.46589368 9.57827718,1.46168579 L9.57827924,1.46168579 Z" id="Shape"></path>
<path d="M9.57894737,3.42075158 C7.88659608,3.42075158 6.5,4.80737263 6.5,6.49969895 C6.5,8.19205947 7.88659608,9.57864632 9.57894737,9.57864632 C11.2712987,9.57864632 12.6578947,8.19205947 12.6578947,6.49969895 C12.6578947,4.80737263 11.2712987,3.42075158 9.57894737,3.42075158 Z M9.57894737,4.78917263 C10.5317492,4.78917263 11.2894737,5.54690158 11.2894737,6.49969895 C11.2894737,7.45249632 10.5317492,8.21022526 9.57894737,8.21022526 C8.62614555,8.21022526 7.86842105,7.45249632 7.86842105,6.49969895 C7.86842105,5.54690158 8.62614555,4.78917263 9.57894737,4.78917263 Z" id="Shape"></path>
</g>
</g>
</g> </div>As a disclaimer: Sentry is a community sponsor of MadeWithVueJS, but we partnered with them because we’re avid users ourselves!
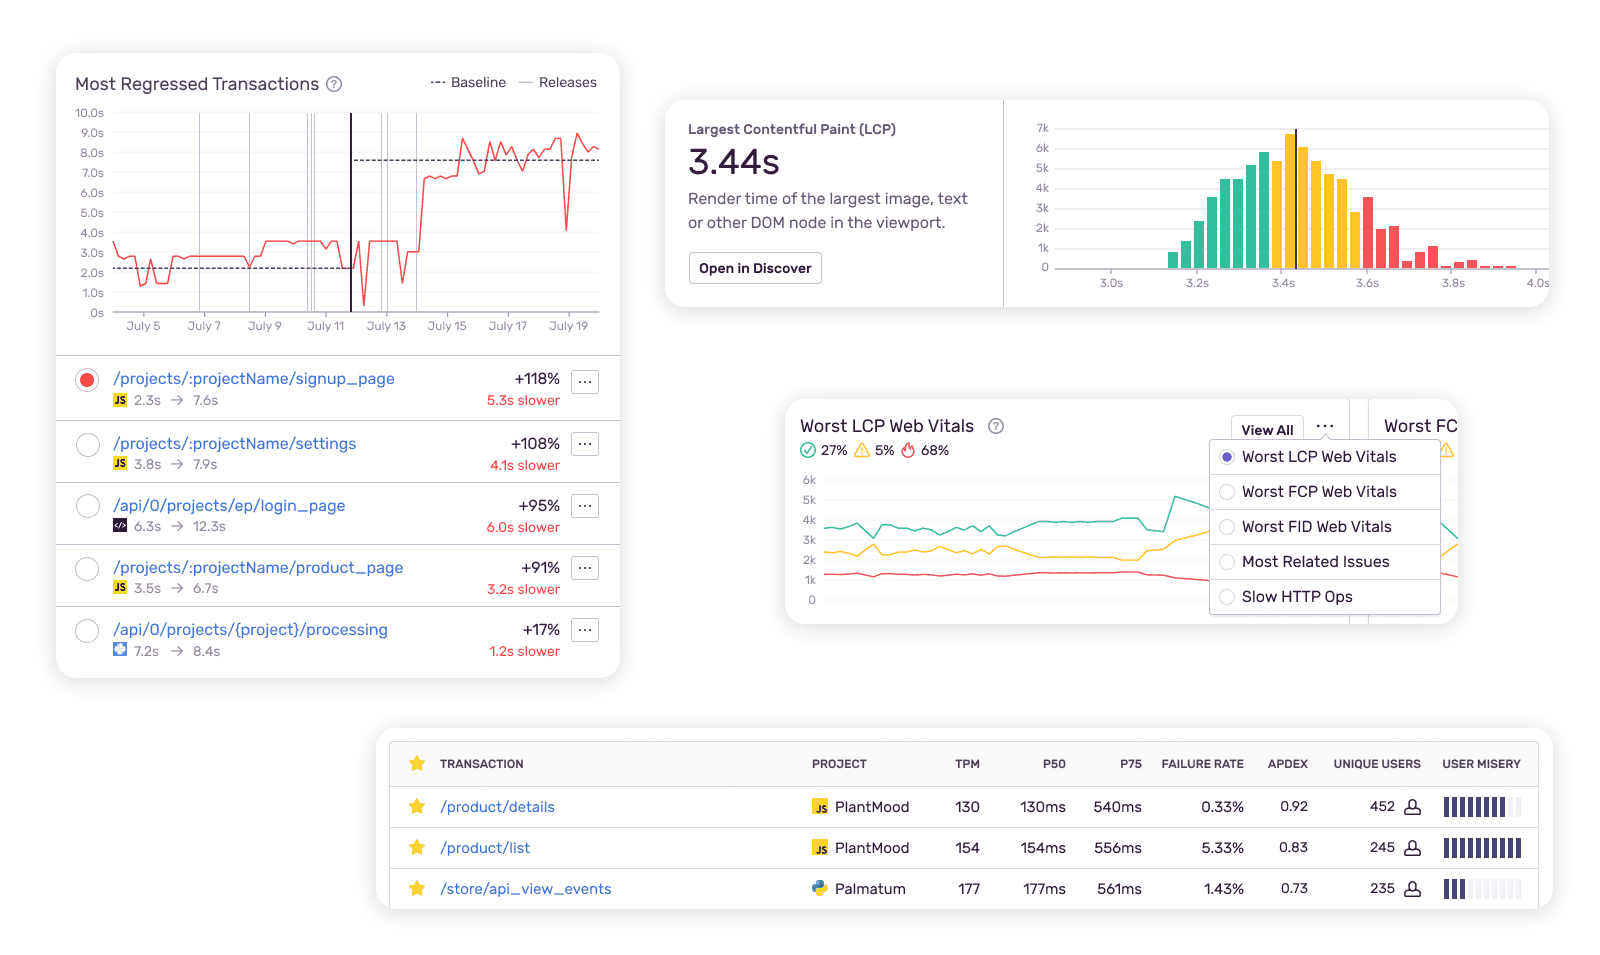
The data in our Sentry dashboard is collected in the "field": It logs all user interactions with our apps which gives us some more interesting data points about performance:
- User misery: This is a custom metric by Sentry that counts the number of users who were frustrated because of unsatisfactory response times. It helps us identify and fix high-impact issues for our users quickly.
- Apdex: Apdex is an industry standard metric to measure overall user satisfaction with the response time of an app, calculating the ratio of satisfactory to unsatisfactory experiences. It’s not really actionable, but it’s still a nice high-level score to keep track.
- Trends / Most regressed transactions: We get a list of transactions that used to be more performant, but have regressed recently. As we’re continuously deploying, this helps us keep track of issues with new releases.
Benefits of performance monitoring tools
Honestly, we’re a small pragmatic team. We’re not using a monitoring tool because we love staring at data, but because it makes our lives easier and our user’s experience better.
- Notifications for UX and performance issues: We have alerts set up when key metrics for important pages / transactions get bad
- End-to-end debug information: We can trace issues through our whole stack (Vue.js + Laravel) and also see information about framework- / Vue-specific problems. (Read our article about how we traced a performance issue from our frontend to our backend to see how that looks like!)
- Data quality: Data from our users and customers is the most meaningful and reliable in our opinion.
No matter which performance monitoring tool you choose, most of them are pretty straightforward to set up for your apps. It's worth it for the peace of mind you get!
Vue.js performance tracing in your devtools
If you want to take a closer look at the loading processes of your Vue app, you can activate the performance mode. With setting app.config.performance in your Vue apps to true, you will see a timeline in the performance tab / timeline panel. (Note: This only works in dev mode!)
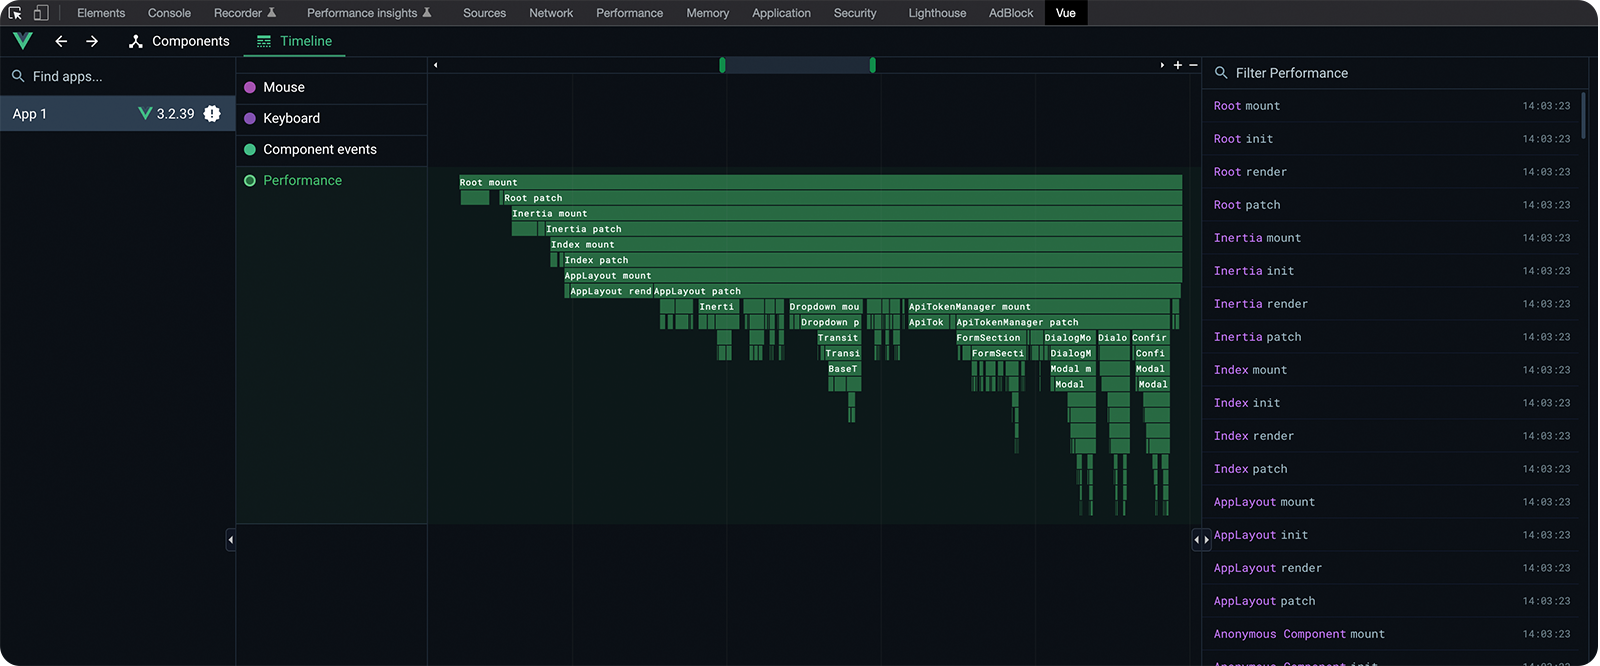
It shows you when each component got initiated (the instance was created), rendered (the VDom structure was created) and patched (the VDom structure was added to the actual DOM). This can help you identify which component might be causing a performance bottleneck in your app and stay sane while debugging it.
Performance goals and budgets
Before you start measuring and monitoring now, it's a good idea to define some target values. We want our app to load fast, but when do we consider it to be "slow"? When do we fail a test, and when do we want to be alerted?
Example goals could look like this:
- Our product pages must score > 90 on Lighthouse performance audits
- Our app dashboard needs to be ready to use (completely loaded and interactive) in under 5 seconds
- Our startpage should be visually complete in under 4 seconds
- ...
This set of limits for our performance metrics is also called a performance budget.
How to define a performance budget for my app?
The limits and metrics in your budget will be unique, as it depends on the type of app you’re building. Do you need to load a lot of data and images or is it text-focused? Do you need to load content in real time or do you only display static lists?
To create your first performance budget, identify core pages like the start page, important landing pages, your app dashboard, shopping cart, product pages etc.
Then you can try these strategies:
- Approach recommended values / benchmarks for your metrics (see e.g. the recommended thresholds for the Core Web Vitals)
- Measure your status quo and aim for a 20% better result
- Measure your competitors and aim for a 20% better result
If you haven't measured anything before, it's usually no problem to optimize for 20% better results (see basic strategies in our Vue.js Performance Guide). Then try to stay within this budget over time!
Do I need a performance budget as a Vue developer?
Your Vue frontend is only one part that contributes to good performance. The performance budget is also used up by your designers font choices, your marketing manager’s need for a chat widget and your backend engineer’s API performance.
Still, JavaScript is one of the most expensive parts of your budget, especially if you’re building SPAs. You have a lot of impact!
A performance budget is a great way to take on your part of the responsibility, and open up the conversation about performance with your colleagues.
You could share some case studies showing the business impact of optimizing performance metrics, or discuss UX patterns optimized for the Core Web Vitals.
Performance is always a continuous team effort 💪
More resources for (Vue) performance monitoring
- Our guide for Vue.js performance optimization
- Our journey how we traced a performance issue from our frontend to our backend
- Vue docs on performance mode
- In-depth information about Web Vitals
- Compare performance metrics from multiple sites with PageSpeed Compare
- Check the Core Web Vitals of up to 500 pages with the Core Web Vitals Check